Improve KPIs with Run-Time Monitoring
It's easy to assume that you know which shift or team at your company is most productive. Maybe you base your assumptions on the experience levels of team members or time of day, but how do you really know?
Atomation recently partnered with a production warehouse facility to execute a condition monitoring program for equipment in use on the warehouse floor. The primary use case was to monitor equipment to better understand usage and improve the preventive maintenance program. Atoms are being used to monitor temperature, impact, tilt, and vibration. Vibration serves as a proxy for run-time/operation. Correlated with temperature, further insight into overall machine performance is now available to the maintenance team.
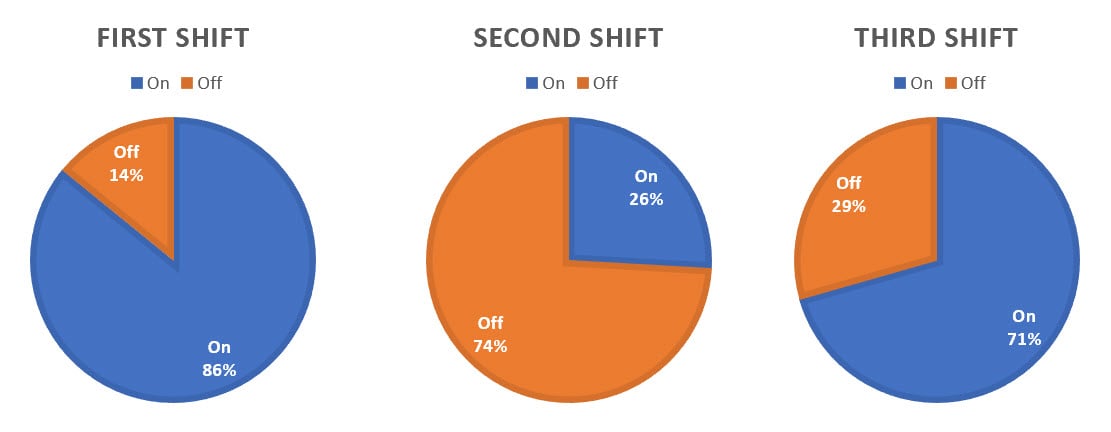
While the condition monitoring program is still in progress, the Atoms revealed interesting insights for the Operations Managers at the facility about the operation by shift immediately after installation about productivity. Not all shifts were operating with the same level of productivity and the difference between shifts was much larger than expected. There are three shifts: morning, afternoon, and then overnight.
Any guesses? We won't keep you in suspense!

The first few days of monitoring revealed that second shift may have a performance problem. Second shift showed less operation during the monitored period: 60% less when compared to first shift! Before we jump to conclusions, it's important to ask questions about what might be driving less usage of the equipment by the second shift team about the other factors that might impact performance. After determining that all things are roughly equal, what steps need to be taken to improve productivity for this team? And how would you know if you had no way to capture equipment run time?
What started as a condition monitoring program turned into an immediate productivity improvement opportunity for the shift managers.
And what about third shift?
It's clear that second shift equipment operation dropped significantly. It's also clear that third shift equipment operation may also need to be explored to better understand the production of the third shift team. Understanding break times, impacts on productivity, training, etc. is central to understanding what drives individual and shift productivity and Atoms give you the information you need to begin asking the right questions.
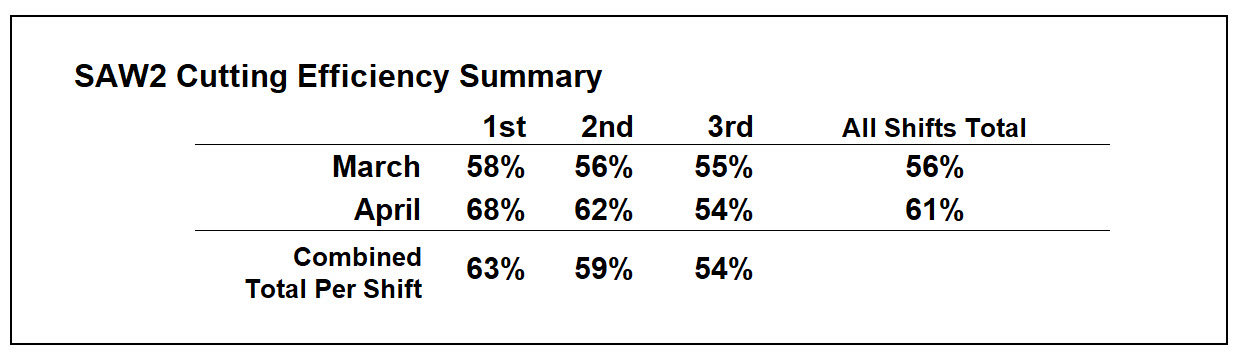
Performance improvement over time
Atomation gave the Operations team the data they needed to improve staff utilization in each shift, resulting in a 5% increase overall in output from Month 1 to Month 2.
What would a run-time monitoring analysis tell you about your operations? How much revenue are you leaving on the table each month due to poor productivity?
The ability to see what's actually happening with equipment operation leads to new improvement opportunities for both personnel and equipment. One of Atomation's previous use cases, Bearing and Motor Monitoring, showed the maintenance teams that bearing temperature actually spiked when equipment was left idling. It was an unexpected piece of information that came from analysis of the data now being captured by the Atoms. The maintenance program was overhauled shortly after getting this data to prevent excessive idling to lengthen machine life.
Contact Atomation today to learn more.