.jpeg)
Installed Atoms: Gateway and multiple AT-R1.0 Atoms
.jpeg?width=282&height=376&name=WhatsApp%20Image%202022-11-30%20at%2012.36.32%20PM%20(4).jpeg)
Atoms are in use just about everywhere these days! A busy port in Africa uses Atoms to monitor crane usage and overall engine health. Atoms monitor tilt, impact, vibration, and temperature using a Gateway installed where the cranes are stored and the smaller AT-R1.0 Atoms on the crane itself. Atoms were installed on the crane using magnets, resulting in a short and simple installation process.
Without previous usage information, the team set thresholds based on a short window of operation. After additional days of operational data were captured, the Atomation team reviewed the findings with the operators at the port.
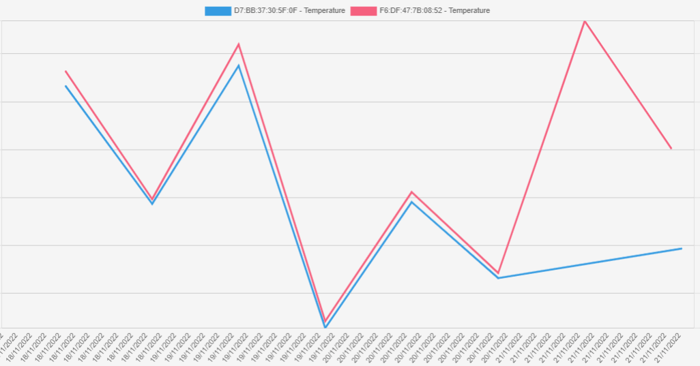
Temperature Threshold Needed to be Lowered
The dashboard data revealed that one bearing was operating at a higher temperature than a similar bearing also in use. Threshold settings were edited, the high-temp bearing was lubricated and the team now has an improved operational profile for the bearing.
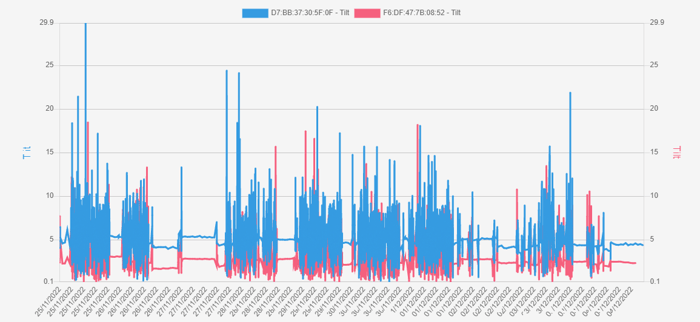
Crane Operation Not Level
The second piece of critical information captured in the dashboard was that the crane was tilting further to one side than expected when moving cargo. By reviewing the side-by-side comparison charts showing tilt, the team identified a potential safety hazard and initiated a review of procedures to ensure that crane operators were not overloading the equipment which could lead to an accident.
Identifying Problems Before Equipment Fails
One final piece of data to come out of the initial installation is also related to temperature. Prior to Atoms being installed, bearings were lubricated on a schedule, regardless of operational performance. The graph below shows the high temperature of the bearing prior to lubrication. After maintenance, the temperature falls back to normal operational levels but in this case, begins to rise almost immediately, showing a quickly increasing temperature trend line over just a few days. The bearing was not due for maintenance in the near-term.
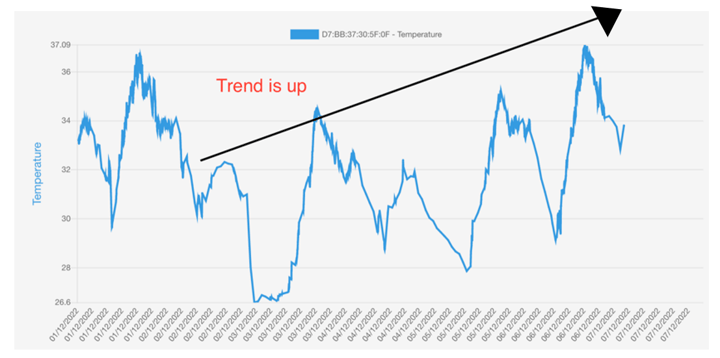
By reviewing the dashboard data, the team can clearly see the temperature increase and investigate what might be causing the issue on this bearing.
Atoms Deliver Actionable Data
As more Atoms are installed in the field, we hear from our customers how much they appreciate the simplicity of the solution and the ease with which problems can be identified and corrected before failures occur. These initial results have led to an expansion of the Atomation installation at the port. We're looking forward to seeing what the next batch of data reveals for this team!