The Technical Architecture Behind Legacy Equipment Monitoring: Edge Intelligence Meets Enterprise Integration
Published by
Guy Weitzman
on
After years of building IoT solutions for industrial environments, I've learned that the most challenging problems aren't always the obvious ones. When we designed Atomation's platform, we weren't just solving how to put sensors on legacy equipment—we were solving how to make those sensors truly useful in real-world operations while seamlessly integrating with enterprise systems.
Legacy equipment represents a unique technical challenge. These assets weren't built with connectivity in mind. They don't have Modbus ports, OPC-UA servers, or Ethernet connections. They're mechanical workhorses that predate the Industrial IoT era. Yet they're often the most critical equipment in a facility, and their failure can mean extended downtime and significant revenue loss.
The Architecture: Why Edge Computing Changes Everything
Most IoT platforms follow a centralized model: sensors collect data, stream it to the cloud, process it on servers, then push alerts back to users. This architecture made sense in the early days of IoT, but it creates several problems for industrial condition monitoring.
Bandwidth limitations. Streaming continuous vibration or temperature data from dozens or hundreds of sensors requires substantial bandwidth—especially challenging in remote industrial locations where cellular connectivity may be limited.
Latency issues. Round-trip communication to cloud servers and back introduces delays. When a bearing temperature spikes, you want immediate notification, not an alert that arrives after data has been uploaded, processed, and analyzed.
Data overload. Most of the data from properly functioning equipment is noise. Storing and processing continuous streams from all sensors creates enormous data volumes with minimal actionable insight.
Atomation's architecture inverts this model. We push intelligence to the edge—directly onto the sensor device. Each Atom runs its own analysis algorithms, monitoring for the specific conditions you've defined as critical. Temperature exceeds your threshold? The Atom detects it instantly and triggers an alert. Vibration pattern changes? The device recognizes the anomaly and notifies your team.
This edge-computing approach delivers real-time detection with minimal bandwidth requirements. The Atom only communicates when there's something worth reporting, dramatically reducing data transmission while improving response time.
Wireless Architecture: More Than Just Removing Cables
The wireless aspect of our platform goes deeper than eliminating cable runs. We've architected the entire system to operate independently of facility infrastructure.
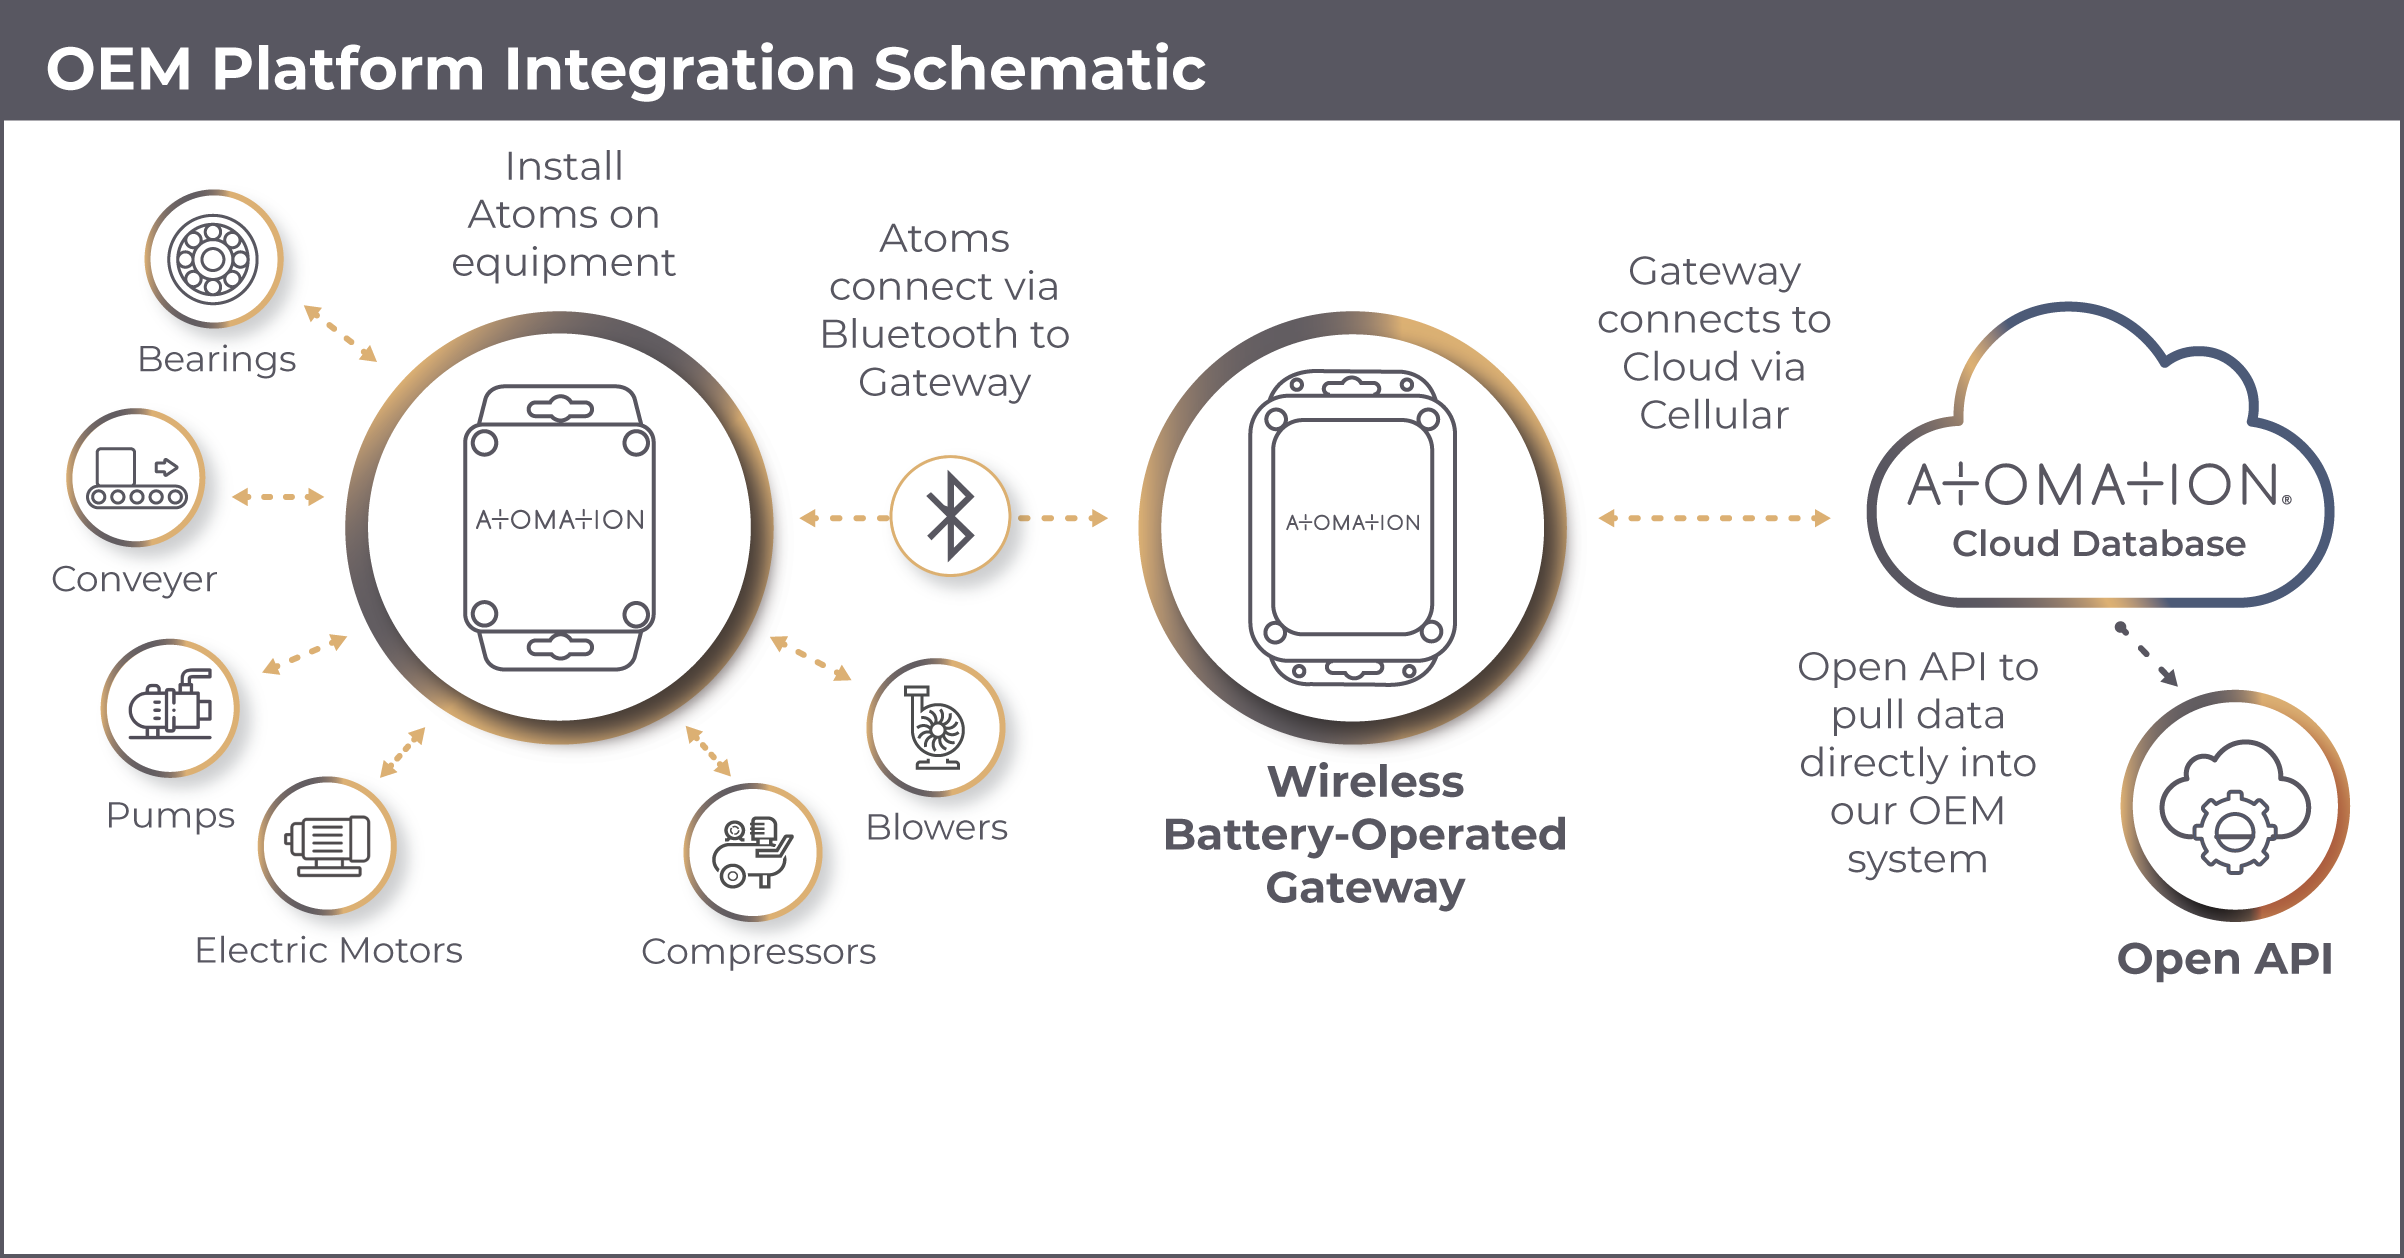
Our sensors communicate using low-power wireless protocols optimized for industrial environments. They can transmit directly to the cloud via cellular connectivity, or they can route through our battery-powered gateway. This gateway is a critical differentiator—it's not a network switch that requires AC power and Ethernet backhaul. It's a self-contained unit that operates on battery power and has its own cellular connection.
Why does this matter? Because it means true deployment flexibility. You can place monitoring anywhere—on remote conveyors, mobile equipment, outdoor installations, or temporary setups. The gateway travels with your equipment or sits wherever you need it, completely independent of power infrastructure or network availability.
From a technical perspective, this architecture also provides redundancy. Atoms can communicate directly to the cloud or through the gateway, with automatic failover between paths. This multi-path communication ensures reliable alert delivery even in challenging RF environments.
The API: Bridge Between Operations and Enterprise Systems
Here's where many IoT vendors fall short. They build great sensors and impressive dashboards, but they trap your data in their ecosystem. When you want to integrate condition monitoring data with your CMMS, ERP, or custom analytics platform, you're forced into proprietary connectors, limited export options, or manual data extraction.
We designed Atomation's REST API with enterprise integration as a first-class requirement, not an afterthought.
REST APIs and Push APIs Architecture
Our API follows standard REST principles with clear, predictable endpoints. Authentication uses industry-standard bearer tokens with configurable expiration. The API returns properly structured JSON responses with consistent error handling.
For developers, this means you're working with familiar patterns. No proprietary SDKs to learn. No unusual authentication schemes. Just clean REST endpoints that follow the conventions your development team already knows.
Comprehensive Data Access
The API provides programmatic access to everything you see in the Atomation dashboard and more. You can query current device status, retrieve historical alert data, pull sensor readings, manage device configurations, and access metadata about your deployment.
This comprehensive access means you can build the integrations your business needs. Send alert data to your CMMS to automatically generate work orders. Pull historical readings into your data warehouse for long-term trend analysis. Integrate device status into your operations dashboard alongside other facility metrics.
Interactive Documentation and Testing
We've implemented our API documentation using OpenAPI standards with an interactive testing interface. This isn't just static documentation—it's a live environment where developers can explore endpoints, modify request parameters, and execute actual API calls against our servers.
When you open our API documentation at atapi.atomation.net/s2s-api-docs, you can see the complete request and response structures for each endpoint. Click "Try it out" and you can execute calls directly from your browser, seeing exactly what the API returns. The documentation automatically generates curl commands for each request, giving you copy-paste examples for your development work.
This interactive approach dramatically reduces integration time. Your developers can prototype the integration, test authentication, and verify data structures all before writing a single line of application code.
Authentication Flow
The authentication mechanism is straightforward but secure. You make an initial call to the auth/login endpoint with your credentials, receiving a bearer token in response. This token gets included in the header of subsequent API requests, providing authenticated access to your organization's data.
Tokens have configurable expiration periods. When a token expires, you can use the auth/token endpoint to refresh it without re-authenticating. This allows your integration to maintain continuous access while following security best practices around credential management and token lifecycle.
Real-World Integration Patterns
In practice, we see several common integration patterns that demonstrate the API's flexibility.
CMMS Integration. Maintenance teams configure Atoms to monitor critical equipment and set alert thresholds based on their maintenance procedures. When an alert triggers, the API automatically creates a work order in their CMMS with relevant equipment data, sensor readings, and severity information. Maintenance personnel receive the work order through their existing workflow without needing to check a separate monitoring dashboard.
Custom Analytics. Operations teams pull historical sensor data via the API into their data warehouse, where they join it with production data, maintenance records, and quality metrics. This consolidated view enables analysis that wouldn't be possible within any single system—correlating equipment behavior with production schedules, identifying patterns that predict failures, and optimizing maintenance timing based on actual equipment utilization.
Enterprise Dashboards. Facility managers build custom operations dashboards that combine data from multiple sources—production metrics from their MES, energy consumption from building systems, and equipment health from Atomation sensors. The API provides real-time device status and recent alert information, allowing management to see the complete facility picture in a single view.
Automated Workflows. Engineering teams create automated response workflows triggered by specific alert patterns. For example, when temperature alerts occur on cooling equipment during peak summer months, the system automatically adjusts HVAC setpoints and notifies facilities staff. The API both receives the alert data and enables the automated response.
The Technical Advantages of End-Point Triggers and Sensor Reading Architecture
One aspect of our platform that's sometimes overlooked is how edge computing and alert-based architecture affect system scalability and reliability.
Traditional IoT platforms that stream continuous data face scaling challenges. Each sensor generates a data stream that must be transmitted, stored, and processed. Double your sensor count and you double your bandwidth, storage, and processing requirements. The costs and complexity scale linearly—or worse than linearly if you need to upgrade infrastructure to handle the load.
Atomation's alert-based architecture scales differently. Each Atom operates independently, only communicating when it detects conditions worth reporting. Your hundredth sensor requires no more infrastructure than your first sensor. There's no central processing bottleneck because the processing happens on the devices themselves.
This architecture also improves reliability. Each Atom is autonomous. If cloud connectivity drops temporarily, the Atom continues monitoring and will transmit alerts once connectivity returns. There's no risk of missing critical events during network interruptions because the intelligence lives at the edge, not in the cloud.
Technical Specifications That Matter
When evaluating condition monitoring solutions for legacy equipment, several technical specifications prove critical in real-world deployments.
Battery Life. Our sensors operate for years on battery power in typical industrial monitoring applications. This isn't achieved through aggressive duty cycling that misses events—it's the result of efficient hardware design and intelligent software that maximize sleep time while maintaining continuous monitoring capability.
Operating Environment. Industrial environments are harsh. Our sensors operate reliably across temperature extremes, in the presence of vibration and shock, and with appropriate IP ratings for dusty or wet conditions. These aren't consumer devices adapted for industrial use—they're purpose-built for the environments where legacy equipment operates.
Communication Range. Wireless range depends on the environment, but our typical deployments achieve reliable communication across industrial facilities without requiring intermediate repeaters. The battery-powered gateway extends coverage when needed, providing flexible deployment options for large or RF-challenging environments.
API Performance. Our REST API is designed for enterprise-scale integration. Response times are measured in milliseconds for typical queries. Rate limiting is generous enough for real-time integration patterns while preventing abuse. The system handles concurrent API clients without degradation, supporting multiple integrations running simultaneously.
The Product Philosophy
Everything I've described reflects a core product philosophy: industrial IoT solutions should be practical, not impressive. They should solve real operational problems without creating new technical challenges.
Edge computing eliminates bandwidth problems and reduces latency. Wireless architecture removes deployment barriers and infrastructure costs. Battery operation enables monitoring in locations where it was previously impossible. And open API access ensures your data works within your broader enterprise systems.
When we add features to the platform, we evaluate them against this philosophy. Does it solve a real problem that customers face? Does it work reliably in harsh industrial environments? Does it integrate cleanly with the tools and systems customers already use?
This focus on practical utility over feature checklists is why Atomation deployments go from planning to production quickly and continue delivering value year after year. The technology serves the operation, not the other way around.
Moving Forward
Legacy equipment monitoring is fundamentally a solved problem from a technical perspective. The sensors, communication protocols, and processing capabilities all exist. The challenge has always been making these technologies practical for real industrial environments and integrating them effectively with enterprise systems.
Atomation's platform—edge computing architecture, true wireless operation, and open API access—represents our answer to making condition monitoring genuinely practical for legacy equipment. It's technology in service of operations, designed by people who understand both the technical requirements and the operational realities of industrial facilities.
If you're evaluating condition monitoring solutions, I encourage you to dig into the technical architecture. Understanding how a platform processes data, communicates alerts, and integrates with your systems will tell you far more than feature lists or marketing materials.
You can explore our API documentation interactively at atapi.atomation.net/s2s-api-docs, and our team is always available to discuss how the platform's technical architecture aligns with your specific operational and integration requirements.
Guy Weitzman is Chief Product Officer at Atomation, where he leads the development of wireless condition monitoring solutions for industrial environments. With a background in embedded systems and industrial IoT, Guy focuses on creating practical technology that solves real operational challenges.